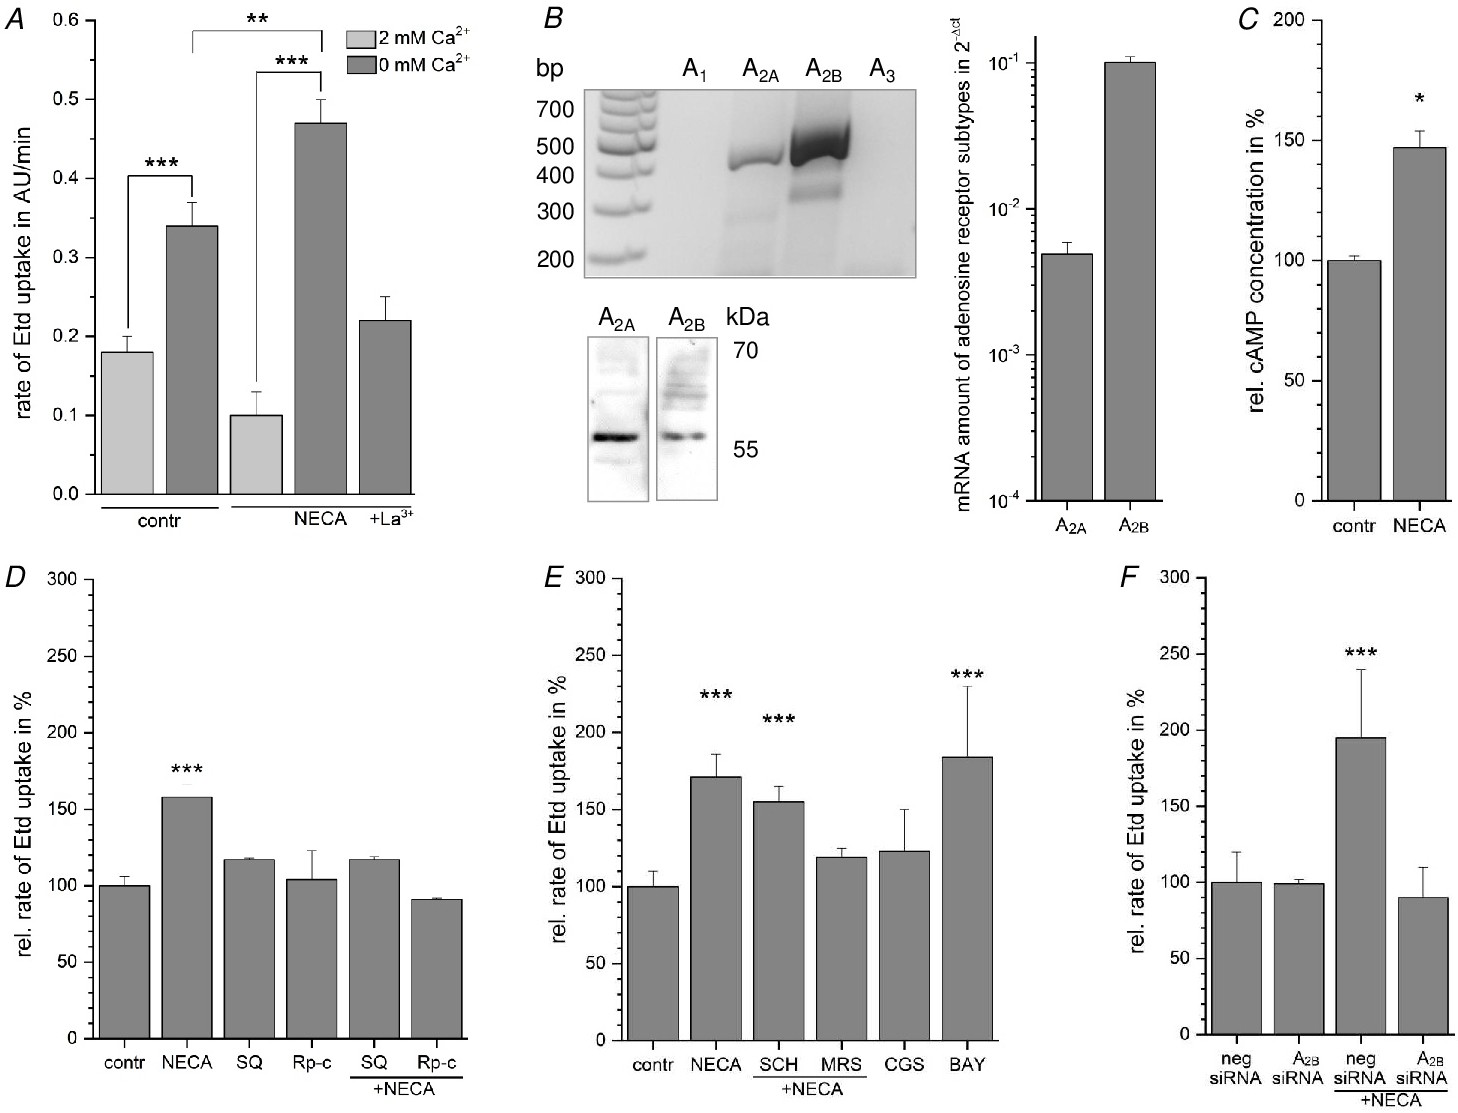
Fig. 4. Expression of adenosine receptor subtypes in Calu-3 cells. (A) Increase in the dye uptake rate induced by NECA (10 µM, 24 h) as quantified from dye uptake experiments. (B) RT-PCR analysis and western blot experiments showed expression of the adenosine receptor subtypes A2A and A2B. qRT-PCR analysis showed a remarkably higher expression of the A2B adenosine receptor subtype. The results are given as average ± SEM from three cell culture passages. (C) NECA increased the intracellular cAMP concentration. The results are given as average ± SEM from three cell culture passages. (D) The increase in the dye uptake rate was attenuated by the AC inhibitor SQ22536 (SQ, 400 µM) and the PKA inhibitor Rp-cAMPs (Rp-c, 200 µM). (E) The NECA-induced increased dye uptake rate was not significantly affected by the A2A adenosine receptor antagonist SCH58261 (SCH, 0.5 μM). The A2B adenosine receptor antagonist MRS1754 (MRS, 0.5 μM) blocked the NECA-induced increase in the dye uptake rate. The A2A adenosine receptor-specific agonist CGS21680 (CGS, 50 nM) did not change the dye uptake rate, while the A2B adenosine receptor-specific agonist BAY60-6583 (BAY, 100 nM) significantly increased the dye uptake rate. (F) siRNA-knockdown of the A2B adenosine receptor subtype blocked the NECA-induced increase in the dye uptake rate. The dye uptake rates are given as average ± SEM from respectively six experiments with three cell culture passages. The data were statistically compared to the control using student's t test (P<0.05 *, P<0.01 **, P<0.001 ***).